
We live in a digital era where data is generated by a wide range of sources, including companies, governments, celebrities, and ordinary individuals. Each of these entities not only produces data but also acts as both a client and a service provider. For example, Company A may be a client of Company B, which, in turn, serves Government X, and Government X serves the people. This interconnected web of clients and service providers forms the backbone of our data-driven world.
In such a complex landscape, the ability to work efficiently has become a paramount concern for businesses, professionals, and organizations. This is precisely why data analysis has risen to prominence as a critical skill. It empowers individuals and organizations to decipher the messages hidden within the data, extract valuable insights, and make informed decisions that can drive their success.
Many individuals and organizations use Excel’s pivot tables for data analysis. If you’re one of them, then this blog is made for you. In this blog, we will explore how to streamline the data analysis process.
Pivot tables, by their very nature, simplify the intricate task of reading, comprehending, and swiftly extracting valuable insights from complex data, making data analysis both easier and faster. However, with the use of pivot table shortcuts and other techniques, you can significantly enhance the efficiency of your overall data analysis process.


Here are some Pivot Table shortcuts that can streamline your data analysis.
- Alt+Shift+F3 – Convert the auto-detected range to data types
- Shift+F10 – Open context menu
- Ctrl+/ – Open shortcuts dialog
- Ctrl+Alt+Shift+H – Read column header
- Ctrl+Alt+Shift+T – Read row header
- Ctrl+Alt+Shift+Page Down – Read a column from the active cell
- Ctrl+Alt+Shift+Page Up – Read column until active cell
- Ctrl+Alt+Shift+End – Read row from the active cell
- Alt+Shift+F3 – Convert the auto-detected range to data types
- Shift+F10 – Open context menu
- Ctrl+/ – Open shortcuts dialog
- Ctrl+Alt+Shift+H -Read column header
- Ctrl+Alt+Shift+T – Read row header
- Ctrl+Alt+Shift+Page Down – Read a column from the active cell
- Ctrl+Alt+Shift+Page Up – Read column until active cell
- Ctrl+Alt+Shift+End – Read row from the active cell
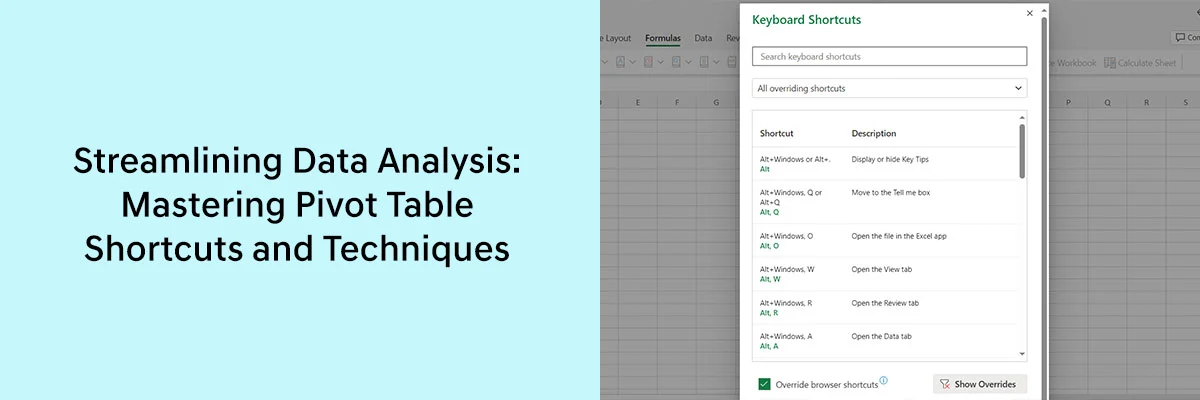
If you want to learn more shortcuts, simply type ‘Keyboard shortcuts’ in the search bar. It will provide you with a list of all shortcuts, and there’s also a filter to help you find the specific shortcut you’re looking for.

The more shortcuts you learn and use in your work, the more efficient you will become in data analysis.
The following techniques will help you streamline your data analysis
- Begin your data analysis journey by ensuring you have all the necessary data collected and organized. Verify that nothing essential is missing before proceeding to create a pivot table.
- Since data comprises numbers and sometimes words, it’s crucial to provide clear and relevant headings for each column where your data is stored. Well-defined column headings facilitate better insights, while a lack of clarity can lead to confusion and issues during analysis.
- Leverage formulas whenever possible to swiftly summarize your data and uncover key trends and patterns within it.
- As the saying goes, ‘a picture is worth a thousand words.’ Enhance your data analysis by using charts and graphs to visually represent your data. This visual approach presents information in an engaging and easily understandable manner, allowing you to identify data patterns more efficiently and rapidly.
Conclusion
In today’s interconnected world, where data flows through a complex network of entities, the ability to work efficiently with that data has become paramount. Data analysis has emerged as a crucial skill, enabling individuals and organizations to extract valuable insights and make informed decisions for success.
Learning shortcuts and employing techniques like thorough data collection and organization, clear column headings, formula utilization, and visual representation through charts and graphs will further streamline your data analysis efforts.
For those eager to delve deeper into the world of Excel’s pivot tables and data analysis, don’t miss our upcoming webinar. Our expert speaker will offer valuable insights and guide you in effectively leveraging pivot tables, elevating your data analysis skills to the next level.