
Data holds immense importance in today’s world, and its potential to drive success for individuals and companies is undeniable. It serves as the foundation for informed decision-making, impacting various facets of businesses, from investments to research and development. Amidst the vast array of tools available for data analysis, Excel’s Pivot Table stands out as a valuable asset. In this blog, we’ll delve into the significance of data analysis and explore how Excel’s Pivot Table simplifies this complex process, offering valuable insights to companies.
Data Analysis: Why Is It Important?
Imagine a cloudy day where the sun disappears, and an unusual calmness envelops the atmosphere. These observable phenomena represent various types of data. Surprisingly, we don’t require complex computing power to conclude that rain is on the horizon. It’s a basic deduction we can make based on the data we’ve collected through our senses.
In essence, this simple example highlights the power of data interpretation. We gather information from our surroundings, analyze it, and draw conclusions. It’s a fundamental human capability. Now, extrapolate this concept to more extensive and intricate datasets, and you’ll discover the potential for even greater insights.
Large sets of complex data contain a wealth of information, each data point contributing to the overall picture. Through careful analysis, companies can decipher meaningful patterns, correlations, and trends. This analysis provides valuable insights that enable informed decision-making. These insights can help identify errors, uncover opportunities, and inform critical decisions across various areas such as sales, manufacturing, and other key aspects of the business.
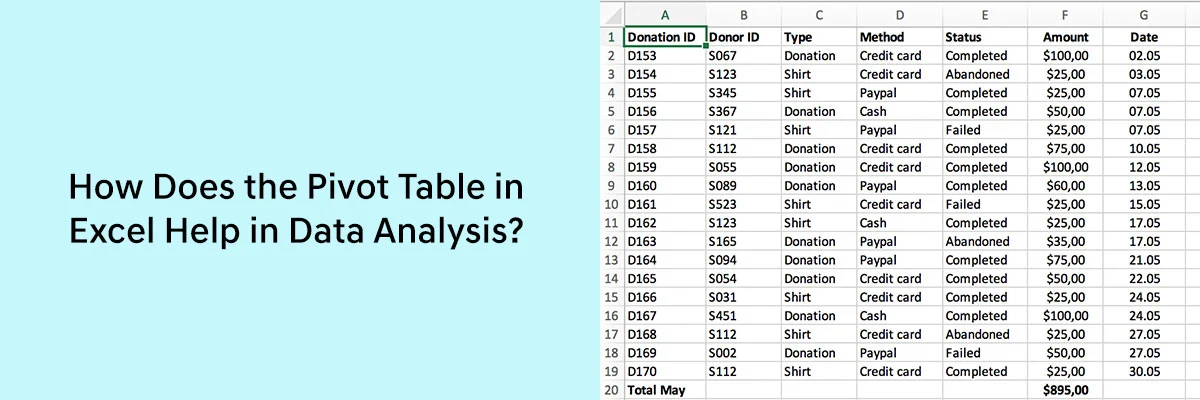
How Do Pivot Tables Help In Data Analysis:
The term “pivot” means to rotate or reorient data. When you create a pivot table, you are essentially pivoting or transforming your dataset from a flat, unorganized format into a more structured and organized table that allows for easy analysis and summarization. Pivot tables within Excel serve as powerful instruments for analyzing data by condensing, arranging, and restructuring extensive datasets into a structured table. They prove invaluable in recognizing data patterns and trends, and facilitating the generation of succinct and enlightening reports.
Pivot tables are especially useful for data analysis because they allow you to:
- Summarize data: Pivot tables serve as powerful tools for data summarization, offering diverse functions such as calculating totals, averages, percentages, and counts. These capabilities enable companies to accurately uncover key data trends and patterns within their extensive datasets. Example: By using a pivot table, you can quickly summarize and compare sales figures across multiple product categories.
- Group data: Companies often deal with diverse, interrelated data across various categories that impact core tasks like marketing, sales, or production. Pivot tables offer a solution to consolidate this data from different categories such as product, region, price, and cost into a single table. This facilitates a comprehensive view of data distribution, enabling easy comparison, and identification of differences, patterns, and correlations within the data or across various groups. Example: By creating a pivot table, you can analyze how product sales are distributed across different regions and identify any regional trends or disparities in sales performance.
- The Sorting of Data: Companies can utilize pivot tables to arrange data either in ascending or descending order, helping them analyze their data to identify the highest and lowest values. This allows businesses to track how their data changes over time.
Example: In a sales dataset, a pivot table can be employed to sort product sales figures in descending order, highlighting the highest-performing products in terms of revenue. - Filter data: In the realm of data analysis, it’s common to encounter diverse data categories, each comprising various subtypes. Pivot tables come to the rescue by offering the capability to filter your data based on specific criteria. This functionality empowers you to refine your analysis, zeroing in on the precise data subtype you wish to examine while disregarding any irrelevant information. This streamlined approach simplifies your data analysis process, ensuring you focus only on the most pertinent data.
Example: Imagine you have a sales dataset with product categories like electronics, clothing, and accessories. Within the electronics category, you can further filter to analyze only smartphone sales, excluding data related to laptops or other devices. This targeted analysis helps uncover insights specific to smartphone sales without distractions from unrelated data points. - Create charts and graphs: Charts and graphs serve as powerful tools for visually representing essential data, making it easier to comprehend and analyze information. Pivot tables excel in the conversion of data into visually impactful charts and graphs, ultimately enhancing the clarity and effectiveness of your data analysis.
Example: You can use pivot tables to create a bar chart illustrating the sales performance of various products over a specific time period, providing a clear visual summary of your sales data.
Here are some examples of how pivot tables can be used in a company by different individuals for data analysis:
- A product manager can leverage a pivot table to assess customer feedback data, helping them identify common pain points and areas for improvement.
- A marketing manager can employ a pivot table to analyze website traffic data, enabling them to pinpoint popular pages, the keywords driving traffic, and the traffic sources that lead to conversions.
- A sales manager can utilize a pivot table to summarize their sales data based on product, region, and salesperson. This assists them in identifying top-performing products, high-sales regions, and the most effective salespeople.
Conclusion
Excel’s Pivot Table is a versatile and indispensable tool for data analysis. It empowers individuals and companies to extract valuable insights from complex datasets, enhancing decision-making across various business domains. By summarizing, grouping, sorting, filtering, and visualizing data, Pivot Tables simplify the data analysis process, enabling more informed and impactful choices.